According to a new survey from Mister Auto, a European-based chain of car repair shops, Ottawa ranks #3 on the 2019 Driving Cities Index of the best cities for drivers. And, yes, the higher the ranking, the better the city is ranked overall on factors such as congestion, gas prices, road quality and cost of parking.

As much as we all like to complain about everything about commuting in Ottawa—from the LRT to potholes—it turns out we’re ahead of many other cities often touted for their quality of life, including Stockholm (#18), Seattle (#45), Amsterdam (#70) and Melbourne (#83).
Looking at the data in detail is fascinating—well, at least it is for a stats wonk like me; your mileage may vary.
What brought Ottawa to the top of the driving rankings?
Factors that appear to have tipped the balance in Ottawa’s favour include air quality (where we ranked sixth) and driving speed inside the city (ninth). People have differing opinions on whether fast city driving speeds are a good thing or a bad thing—just ask anyone involved in traffic calming—but this survey considers fast speeds a plus.
On the other hand, factors where Ottawa doesn’t score so well against other cities include road quality (55th) and public transit (72nd)—neither of which will be any surprise to anyone who has navigated their way around the swimming pool-sized potholes on some of our major arterials or tried to muscle their way onto an OC Transpo bus in rush hour. (The study was done before the LRT opened, so our public transit score might be even worse now.)
It’s interesting to see how other cities fare on some of these metrics. Not surprisingly, New York City ranks tops for public transit, while four Swiss cities—Bern, Basel, Zurich and Geneva—all have perfect scores for road surface quality.

Another intriguing measurement is road rage, the one element where a low score works in a city’s favour. The three least angry cities are all in Asia—Osaka, Tokyo and Singapore—while Ottawa comes in at 30th.
What about other Canadian cities?
But, of course, I know what you’re all wondering: How did we do against other Canadian cities? Sadly, our #3 overall score doesn’t make us the winner, as Calgary is the #1 metropolis among the 100 in the study.
Astonishingly, Vancouver rings in at #6. Given what I know about the peninsular city’s reputation for traffic jams, I was so gobsmacked by this score that I had to examine it in more detail.
Sure enough, Vancouver ranks #76 in terms of congestion, but it’s in the top third for factors such as a low rate of traffic fatalities. Where it really shines, though, is in terms of air quality, where it ranks fifth among all cities surveyed.

What about environmental factors?
It’s a quirky survey, because it clearly proves the adage “What gets measured, gets managed.” Just look at Vancouver. I suspect its high rank for air quality is directly related to its very low rank for cars per capita, where it comes in 96th overall. The survey’s designers consider a low proportion of cars per capita a bad thing. As they say on the survey’s website, “The higher the number of cars per capita, the greater the demonstration of a city’s driving uptake and attractiveness for motorists.” Since this survey is meant to measure the appeal of a city to drivers, that makes sense.
However, if you were looking at things through an environmental lens (and that, frankly, would be my preference), you’d probably get a very different picture. I think air quality is a much more desirable goal than most of the other elements ranked in the survey. And personally, I’d love it if our public transit rankings went way up and our cars per capita went way down. If it were easier to get around town without a car, I know I would happily stash the gas-guzzler in the garage or get rid of it entirely.
Yeah, I know that’s a weird stance for someone who writes about road trips! But I’ve always thought that road trips should be easy for everyone—not just people with cars—to enjoy. Buses and bikes run on roads, too. And trains run on railroads.
How do Toronto and Montreal rank?
Finally, I can hear you wondering: How do our great local NHL rival cities rank against Ottawa in the overall driving standings? Montreal comes in at #28 and Toronto is #50.

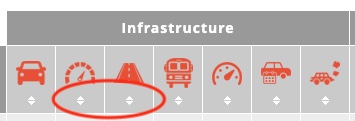
If you check out the survey’s website and want to see how cities score on individual factors, click the little triangles under the icons at the top of each column. That will allow you to sort the statistics by that factor.
So, what do you think of this survey? Let me know in the comments.
And if you like taking road trips in and around Ottawa, subscribe to my free weekly e-newsletter, packed with tips on places to go and things to see.
